In the previous post, we discussed about
using data tips for improved debugging experience. We also discussed how we can export them for a future visual studio session involving the same code base. I realized that there are various little features, related to break points are also there, which developers don't generally use while debugging. This post is to discuss how we can use break points efficiently for debugging our code. This is also intended to unveil and highlight any unknown useful feature involving break points.
Breakpoints are used for easily stepping through the code for improved debugging experience. Visual Studio attaches the code with a running process. It then allows breaking the code execution when a certain condition occurs. Breakpoints involve breaking the code in a non-exception related scenario although we can insert break points any where in the code we want.
Location and Data Breakpoints
Traditionally there has been two types of break points. They are
Location and
Data Breakpoints. The data break points are used for addresses in memory when the value at a certain address changes. For managed code, this feature is not available in Viusual Studio.
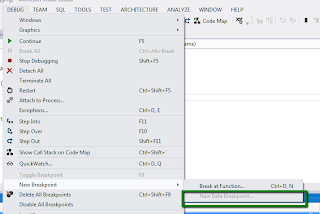
We can also see the similar disabled menu in Breakpoints window.
 Location based break points
 are defined on a particular location. The break points can be set on a particular statement including statements within a lambda. There are two types of location based break points. One can be called as
Normal break points which are just identified with the particular location. These break points are hit whenever the code corresponding the specified statement is executed. The other are
advanced break points which are created when we assign certain details to the break point including hit count and condition which should be true or changed in order to break the execution of the code.
The feature also supports trace messages when a break point is hit. They are called
Trace points. We can also select that the flow of execution is not broken when the trace message is written.
Inserting Breakpoint
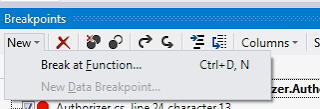
There are different options in Visual Studio to insert break points. The first option is to directly insert it using the Breakpoints window. Just select
Break at Function from
New menu. The default key combination is
Ctrl + D + N.
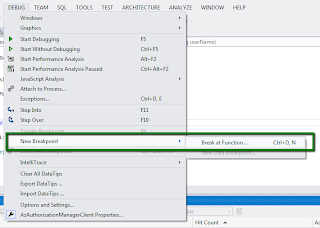
The same option is available in
New Break Point option from
Debug menu. The same key combination is applicable as it would show the same dialog for inserting Breakpoints.
Both these options would result in the following dialog box. You can specify the class and function name where you want to insert this break point.
You can select the language too but selecting a different language wouldn't result in any error message and the Breakpoint would be added to the Breakpoints window but it wouldn't be inserted in the actual code. It does make sense not to insert the BreakPoint but it would have been better if there was any error message.
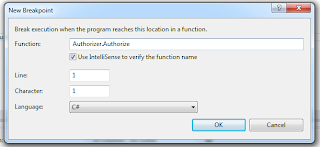
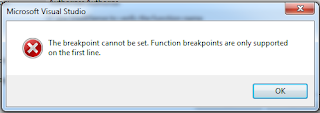
You can specify line number but
any number other than 1 results in the following error message:
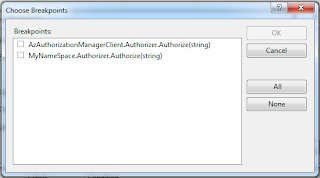
If there are more than one class and functions exist in multiple namespaces with the same name, an option would be provided to select the exact function. We can also select multiple places to insert the Breakpoints. Here we have added a new class in a different namespace with the same function name then following dialog is displayed to select the Breakpoints.
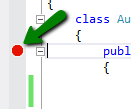
 Toggling Breakpoints in Text Editor
When code file is being displayed in Text editor, you can place cursor at certain location and toggle the Breakpoint. Toggling the Breakpoint would insert the break point if it doesn't exist at the particular location, it would otherwise delete the specific Breakpoint. Here we have the cursor at the function, the following Debug menu should be available to insert the Breakpoint in the context menu if you right click at a certain location.
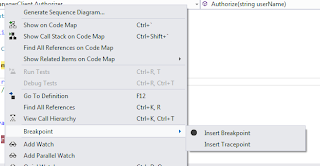
Alternatively we can also click on the side gutter, it would also perform the same toggling function for a Breakpoint.
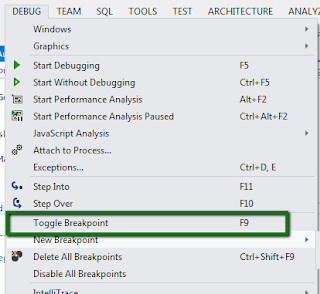
When code is being displayed in the editor, the following option in the main Debug menu should also become enabled. The default key combination for toggling the Breakpoint is
F9.
 Inserting Breakpoins through Call Stack Window
The Breakpoints can also be inserted using Call Stack window. Just select the particular stack frame where you want to insert a Breakpoint. The Breakpoint would be inserted where the function is returned following the stack trace.
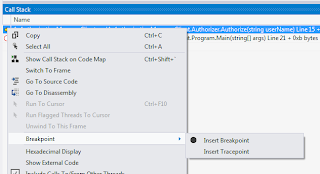
Insert Trace Point is used to insert a trace point at the selected location. They are used to write trace point. We will be discussing about them further in this post under
When Hit section.
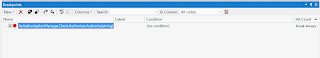
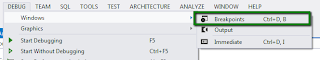
Breakpoints Window
Breakpoints window is a tool window providing the list of all Breakpoints in the solution. In the following image, you can see that it is listing the Breakpoints in one of our sample application.
The window can be displayed using the Debug Menu item by following through Debug Windows. The default keyboard shortcut key is
Ctrl + D + B. In the below image you are just seeing the windows available when the break point is not being hit and the program is not in Break mode, otherwise, you should see a list of Debug windows available here.
 Grouping Break Points
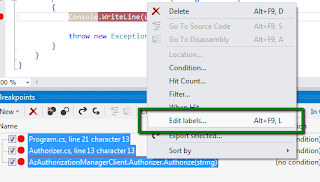
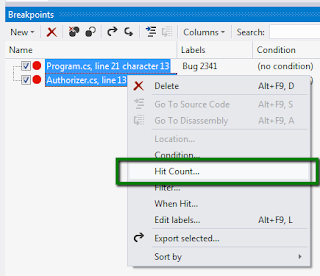
Breakpoints can also be labeled. These labels can then be used to sort and search through the Breakpoints. More than one Breakpoint can be assigned with the same label which can be used for grouping them. A Breakpoint can also be individually labeled. We can select these Breakpoints in
Breakpoints window and select
Edit Label from the context menu.
<
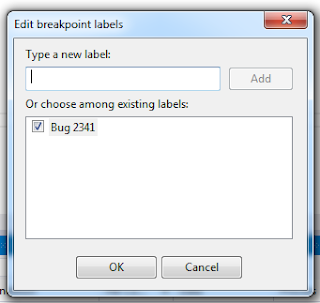
It allows us to select from among the list of labels created earlier. We can also create a new label and assign to the Breakpoint.
These labels are displayed in the Labels column in Breakpoints debug window.
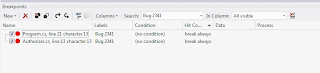
Breakpoints can also be assigned with multiple labels. In this case all of these Breakpoints would be displayed in a comma separated fashion. The following Breakpoint is assigned to a line in the code. The code is assigned with two Labels. They are shown as follows:

These labels can now be used for search. We can disable all the Breakpoints in the code and search for the Breakpoints with a certain label. The Breakpoints with the particular label can then be enabled. This should make the debugging experience a lot better by allowing us to focus in the code area we mean to debug. By default, all columns are used for searching in the Breakpoints window but you can also specify any list of columns the IDE should use to search the specified pattern.
Enable / Disable Group of Break Points
As discussed above, Breakpoints can be enabled or disabled any point we require. A disabled breakpoint is shown as an empty circle in the side gutter of the window and in Breakpoints window. This shows that the code execution would not be broken when the line involving the specified line is hit. After searching the Breakpoints of interest, we can enable / disable those Breakpoints using the following in Breakpoints window.
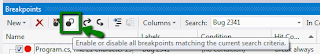
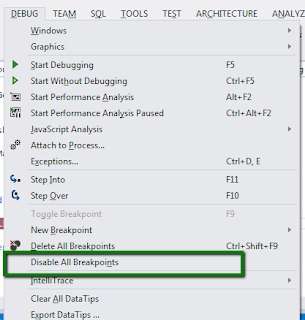
Alternatively we can enable / disable all Breakpoints in the solution. This can be achieved by removing any search criteria and enabling / disabling all of them by selecting the option discussed above. Alternatively, this option is also available in Debug menu.
 Delete Break Points
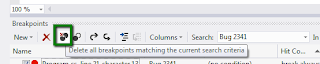
The same search feature of Breakpoints window can be used to find the Breakpoints we expect to delete. We might need to delete all Breakpoints we inserted to determine the cause of a defect which we have fixed now. Just select all the Breakpoints and hit Delete button in Breakpoints window.
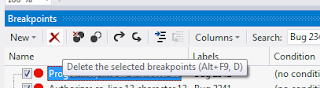
A Breakpoint can also be individually delete. Once deleted, the breakpoint is removed from the Breakpoints window and Breakpoints icon is also removed from the side bar of the code editor.
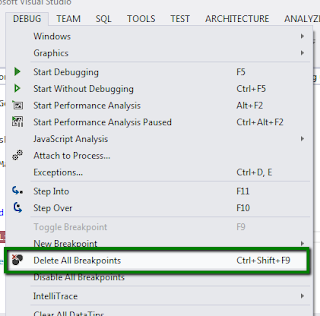
We can also remove all Breakpoints in the solution using the
Delete All Breakpoints option available in main Debug menu.
 Export Breakpoints
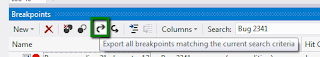
Visual Studio 2012 also supports exporting these Breakpoints. As a matter of fact, this options was introduced in Visual Studio 2010. We can search the list of Breakpoints in Breakpoints Debug window and export them. These Breakpoints are exported in an Xml format to a specified file. The file is saved by using Save File Dialog where user specifies the name of file including its path.
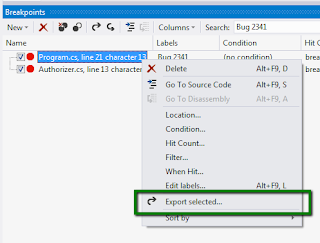
The Breakpoints can also be individually exported. Just right click a Breakpoint in Breakpoints Debug window and select Export.
As discussed above the Breakpoints are exported in Xml format. The following is an example of exported Breakpoints from one of our sample projects created in some previous post.
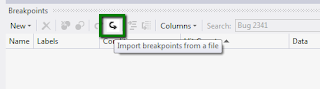
The exported Breakpoints can then be used for a future Debugging session by the same user. They can also be shared with some other developer in the same team improving team collaboration. Just selecting Import should allow you to specify a source Xml file with the Breakpoints.
 Advanced Breakpoints
Visual Studio IDE also supports advanced Breakpoints. These are the Breakpoints with added specification. They include Breakpoints with Hit count or conditions details. We can also specify process and thread related specifications for the Breakpoint definition. This is specially useful when more than one startup projects are selected or the code is being debugged in multithreaded scenario. These are displayed with an
additional + sign in the side bar in the code editor. The same sign is used to show them in Breakpoints window.
Break When Hit Count
The default Breakpoint breaks the execution of code as many times the line involving the Breakpoint is being executed. We can provide extra details including to break the execution of code after the code has been hit so many number of times or a multiple of a number.
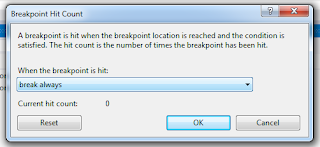
The following is the default hit count selection i.e.
Break always. We can obviously change it.
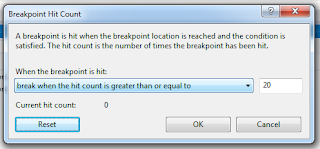
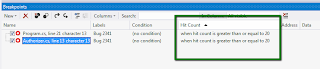
Here we have changed the Hit Count details so that execution should break flow only when the specified statement is being executed for the number of times specified, or greater than that.
As discussed above, since it is an advanced Breakpoint, it is displayed with a
+ sign inside a circle. The circle is filled for an enabled Breakpoint, otherwise, for a disabled Breakpoint, it is empty.
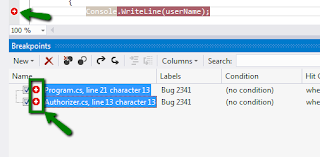
Updating the hit count details should update the Hit Count column in the Breakpoints window.
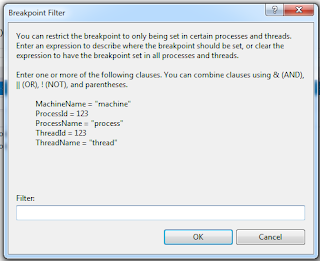
 Breakpoint Filters
Breakpoint filters are provided to qualify a Breakpoint with details including machine, process or thread. The machine details would be useful remote debugging sessions. Process related information can be used to debug code involving more than one process specially under the case of multiple startup projects in Visual Studio IDE.
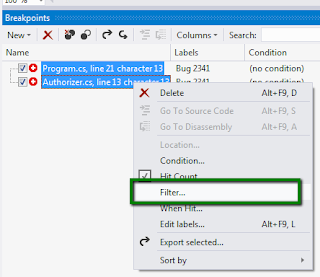
We can even create expressions by joining various little expressions. The dialog is also handy in helping to create the expressions by providing info of the place holder variables for process, thread or machine specific information.
 Conditional Breakpoints
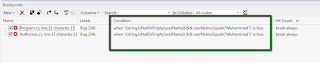
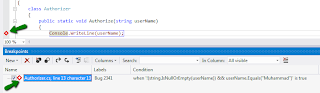
A Breakpoint can also be qualified with a simple condition. This specifies that the breakpoint should only break execution when a a certain is either true or it is changed compared to the last time when this was being executed. Please remember that this is still a location Breakpoint which would be hit when the specified line is being executed. This is not a Data Breakpoint.
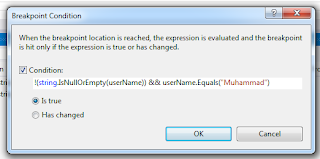
These conditions are displayed in the Conditions column in Breakpoints window.
 Writing Trace Messages
Visual Studio also supports writing trace messages when a Breakpoint is being hit. Just search the Breakpoints of interest, and select "When Hit" from the context menu, the following dialog should be displayed:
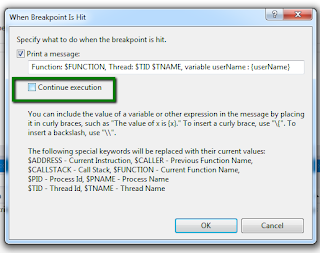
These traces include the variables under scope. In the above example we are adding the value of a userName in the trace message. They are added using curly brackets. Please notice
Continue execution option. Checking this option
converts the break point into a trace point. A trace point is displayed as a diamond icon.
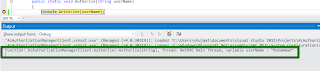
The trace messages can be noticed in the Output window as follows:
This is actually an updated feature in Visual Studio 2012. In Visual Studio 2010, the same dialog includes option for adding a macro to the details. The macro would be executed when the break / trace point is hit.
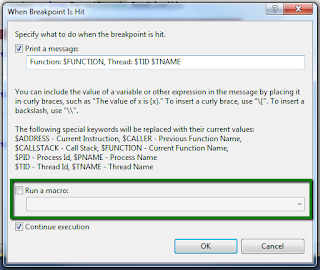
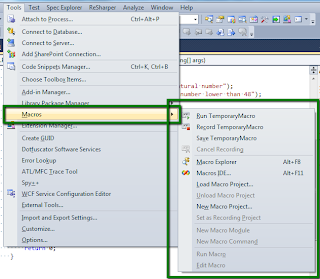
Due to very limited use of the Macros by the development community, Visual Studio 2012 has removed the feature of macro. It is removed from all the places which referred to macros including breakpoints. Visual Studio 2010 had support of Macro definitions. The option was available under Tools menu.
 Breakpoints Not being hit
Break points should appear unfilled with borders on the side gutter display. Mostly it is just because the assembly couldn't be loaded to cause the break point to hit. Many a times, the assembly is just referencing a different version of .net framework including the following:
- The target framework of application is target a client profile while the assembly is referencing the full .net framework.
- The assembly has been built using X86 configuration, being loaded in a 64 - bit application.
In order to determine the list of assemblies loaded while debugging, Debugger modules window can be used in Visual Studio. SysInternal's Process Explorer can also be used for the same purpose.
Fusion log viewer can be used to determine binding failures for assemblies.
Download ad PDF
Debugging using Break Points


