If Software Development is an art then we (developers) should be called artists. An artist needs canvas to bring life into lines and colors. Debugger Canvas is a Visual Studio Extension to help debugging by providing a code bubble canvas where each bubble represent a portion of the call hierarchy. It is a Dev Lab's Power Tool developed which is now available as a Visual Studio Extension. In order to develop this, Microsoft's Code Canvas and Brown University's Code Bubble team joined hands. They worked in collaboration with Visual Studio team to come up with this amazing debugging experience. Currently, the only option to look at the call hierarchy is to look at the Call Stack Window. This can become really difficult for multithreaded and parallel code.
 Code Canvas
 is a Microsoft Research Project. This project is about developing an multi-layered and infinitely zoomable surface for software development. You can get further information about this from their
main page.
Brown University's main page for
Code Bubble's team can be found
here. It is a front-end to
Eclipse. The code is available on SourceForge.net and can be
downloaded. The idea of code bubble is coding for working sets. They are functions, documentations, notes and any other information that a developer need to implement a use case. This might be introduction of a new feature of fixing a defect in code. It works by displaying the editable functions in the form of bubbles on the view. These bubbles are fully editable and grouped in working sets. These bubbles are backed by code files and can be moved across the working sets. These working sets are displayed in a large bubble area. Kael has discussed about Code Bubble, Code Canvas and Debugger Canvas and their differences:
http://blogs.msdn.com/b/kaelr/archive/2012/03/10/code-canvas-vs-code-bubbles-vs-debugger-canvas.aspx
* Code Bubbles is a trademark of Brown University.
Visual Studio Extension for Debugger Canvas
Debugger Canvas is available as a visual studio extension in Visual Studio Gallery. It is made available by as a DEVLABS project provided from Debugger Canvas Team. The extension was last updated on 02/15/2013 and it is available as version 1.1. The limitation is that it is not available for Visual Studio 2012. The extension is only supported for
Visual Studio 2010. The documentation suggests that it would only work for
Ultimate Edition.
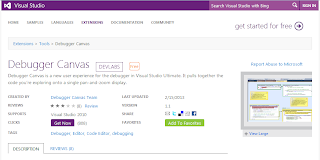
The extension can be downloaded from the following link:
http://visualstudiogallery.msdn.microsoft.com/4a979842-b9aa-4adf-bfef-83bd428a0acb
The extension has a dependency on another extension VS Fragments.
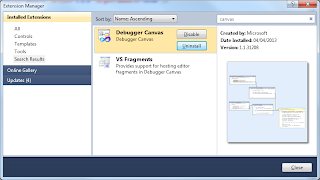
The documentation of the extension suggests that the extension would work only with Visual Studio 2010 Ultimate Edition. I tried installing it on Visual Studio 2010 Premium RTM and it installed successfully. The documentation also suggests that some features wouldn't be available on RTM version and SP1 is required. I noticed that there is no intellisence during debugging in code fragments / bubbles in canvas window. Since there is no intellitrace available for Premium edition, I couldn't test the code bubble tree created by dropping an intellitrace event on the canvas.
What is Debugger Canvas?
Debugger canvas adds features in Visual Studio 2010 to improve debugging experience. The whole idea is to provide a single canvas. This is a pan and zoom surface i.e. it can be zoomed in and out, plus we can pan the window by dragging it from any point in the surface.
The canvas appears as a tabbed window. It shows the code portions in the form of bubbles / fragments. The bubbles support stepping through the code like the already existing debugging feature in Visual Studio. The only difference is that each call is shown as a bubble with an arrow directing from caller to the callee code. This is a debugging experience which is completely temporary i.e. it can not be persisted as is.
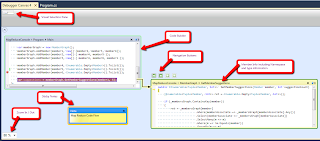
There are also other features in the surface. The greatest of all is the enhanced search. We can search the code for any references and it would show all the patterns available in the code bubbles in the surface. just right click anywhere in the canvas surface, you should see the following options:
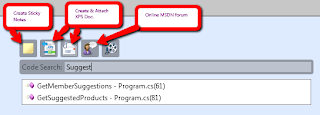
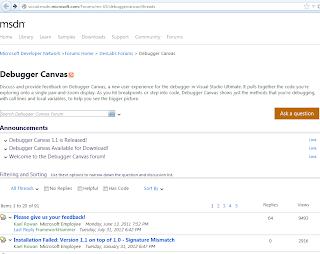
The online MSDN forum is about discussion and announcement about the tool [
http://social.msdn.microsoft.com/Forums/en-US/debuggercanvas/threads]. Like other MSDN forums, you can ask questions which is then discussed by other members of the community.
 Debugger Canvas Menu
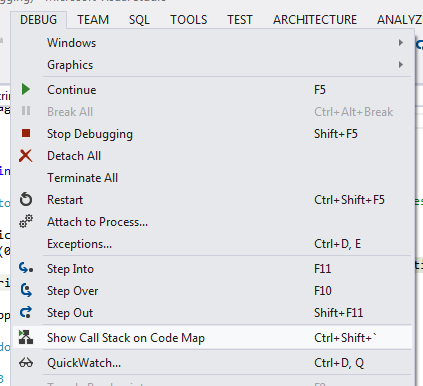
Installing the extension would make the necessary features in Visual Studio. This includes the additional Debugger menu. Notice that I can run it with Resharper. The documentation suggests that they are not compatible.
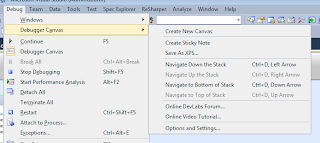
Please notice the options for saving the canvas to the XPS document. You can also do this by one of the context menu options available in the canvas.
LifeTime of Debugger Canvas
As discussed above, debugger canvas is a pan and zoom surface helping debugging of complex code. Code fragments / bubble appear on the canvas as they are called. The
lifetime of a Debugger Canvas is for a single debugging session. As we have discussed before a debugger canvas is represented as a single tabbed window, this window can be used for the next debugging session if this is still opened. It uses the most recent canvas window if more than one are opened.
Intellitrace & Debugger Canvas
Intellitrace is another debugging tool to help debugging experience. It is available with Ultimate Edition of Visual Studio. The traces generated through Intellitrace can be used by Debugger Canvas to see the call hierarchy using code bubbles with all the parameters. This call hierarchy can always be exported into XPS format to share it with the concerned parties.
Debugger Canvas Settings
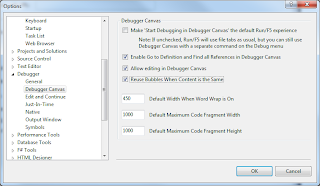
There are some options in Debugger Canvas which are configurable. The configuration settings are available under [
Debugging -> Debugger Canvas] in
Tools -> Options dialog. The same dialog is available under
Debugger -> Options and Settings.
 Starting Debugger Canvas
A user can select how he wants to start the Debugger Canvas. This can be controlled based on the following settings:
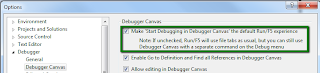 When this option is checked
, any time user starts a debugging session, Debugger Canvas is used. The first break point hit creates the bubble. These bubbles are added / reused as we keep stepping into the functions. This option is based on code analysis functionality in Visual Studio which transforms code into
generalized graph based model. The same functionality is used by Architecture Explorer, available in Visual Studio Ultimate Edition. This actually requires some extra work when debugger canvas is used for debugging, compared to general file based debugging experience in Visual Studio. This requires scan of the whole solution and generating a graph based model. So selecting this as default option, it might be slower to start the debugging session.
Un-checking this would use the general file based session in Visual Studio. You can later invoke the debugger canvas using the following toolbar added with the installation of the extension. This is available when you start a debugging session.
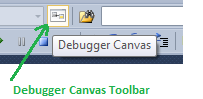
The option is disabled when we get out of the debugging session. I have noticed that if you have this option unchecked and start a debugging session and just have the debugger canvas window opened in a tab, it would start using the canvas. I think this is just to use canvas as it is definitely a better debugging experience. It might seem like a defect for other developers as they might not expect this.
Debugging recursive code
It has been traditionally very difficult to debug recursive code because of complex call hierarchy to the same methods. Debugger Canvas becomes specially useful for debugging recursive code. This allows to disable the reuse of bubbles for the same content. This can be used to have a new bubble for each call with the exact call hierarchy. It even provides the values of local members for each bubble in the hierarchy. What could be better than this?
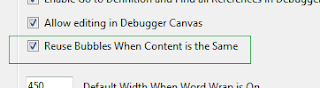
Just to show the benefit for this visually, let's uncheck the above setting and start debugging using debugger canvas. Let's consider the example of fibnacci series. The following is a recursive
implementation of Fibnacci series. You can see that each call is represented in the canvas. You can also appreciate how local variables are also available in the call hierarchy.
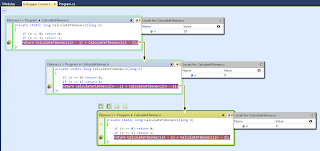
Actually this setting came from neither Code Canvas nor Code Bubbles individually. Code Bubbles has a non-historical design where it doesn't reuse any bubble and every time a new bubble is created even if the users steps into the same code. This has the advantage of simplicity and predictability. On the other hand, Code Canvas works in historical mode and it reuses the fragment if the same code is hit again. This keeps the canvas real estate occupied by less number of fragments. For Debugger Canvas, user is given option to decide what mode he wants to select and the debugging experience is updated based on this selection i.e. Historical Vs Non-Historical debugging using bubbles.
If your call hierarchy are not like that then reusing the bubbles would definitely simplify the view.
Local Variables Snapshots:
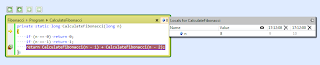
If a code bubble is being used multiple times then we can just take a snapshot of local variables. These snapshots are taken with time stamps. These values can then be used to compare with the local values whenever the same bubble is used again. In the following example we have taken a snapshot of a recursive method and compare the values from the values when we took these snapshots.
 Canvas Debugging Channels
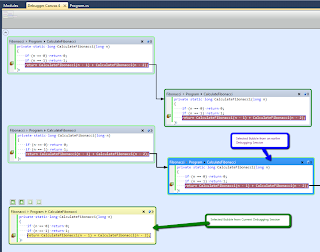
As we discussed above, the canvas is displayed as a tab window. The bubbles for each new session are provided in the form of horizontal channels. The canvas keeps the channels from previous debugging channel which might help in comparing the current session from any previous one. We can easily determine if the bubble is from a previous session as the border turns blue as we select it. For a bubble from the current session, the border becomes yellow. We can pan and zoom to just focus on the current channel. It is easy to navigate between different areas in the canvas by using the Visual Selection Pane on the top. It is based on an expander. It provides the display of the pane using a Visual Brush.
 Call Hierarchy
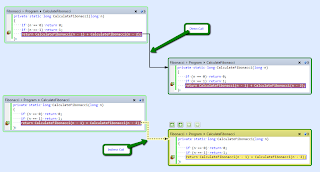
The canvas supports removing the bubbles from the call hierarchy. How the display would look like if we remove a bubble from the middle of the hierarchy. In the image below, I have the channels from two debugging session. For the current session, I have removed a bubble from the middle. Initially, it appeared that there is no relationship between the ancestral code block but when I dragged the child bubble a little on the canvas, it did create a dashed line showing an indirect caller - callee relationship.
 Editing in Debugger Canvas
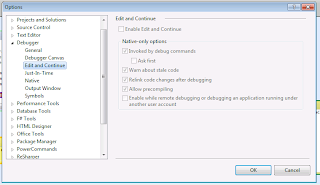
The canvas allows editing of code while debugging. Just put the cursor at the place in the code that you want to modify and just update the code. This can be configured though, which can be disabled.
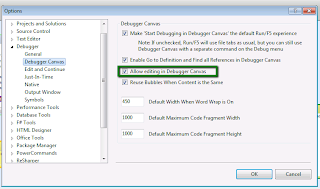
When I tried this feature, I was thinking it would depend on the
Edit and Continue feature but it doesn't, even when Edit & Continue is disabled.
 Integration with Existing Debugging Tools
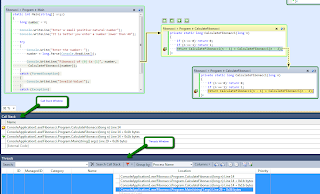
The debugger canvas seems to be completely integrated with the existing debugging tools in Visual Studio. In the following, the Call Stack and Threads toolbar window is displayed. As we double click an item in the call stack from either of these, it results in a bubble in the canvas. It also creates a call relationship by using arrows.
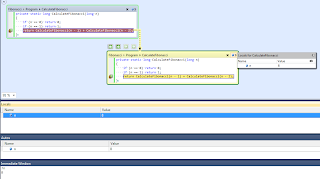
It is also integrated with other debugging tool windows including
Autos,
Locals and
Immediate windows. Since we have the support of local members right on the canvas, I don't think anyone would use Locals and Autos when using a Debugger Canvas. But Immediate Window would definitely be very useful.
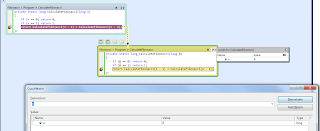
It is also integrated with
Quick Watch Window.
 Integration with Visual Studio 2012
The major road block is that it is
not supported in Visual Studio 2012. It is understandable that this is a parallel development started somewhere in 2010 when Visual Studio 2012 wasn't even available. There should be an real effort to support Visual Studio 2012. I also think that this should be available in non-Ultimate editions of Visual Studio but since it is based on some features, including code analysis feature, which are only available in the ultimate edition, it seems obvious that it would be really difficult or impossible to provide it for other editions.
Research Paper on Debugger Canvas
This discusses the details about the design choices with Debugger Canvas. This also sheds some light on the initial community feedback of the tool. It mentions some of the motivations about the feature design choices. [
Kael Rowan, Robert DeLine, Andrew Bragdon, and Jens Jacobsen, Debugger Canvas: Industrial Experience with the Code Bubbles Paradigm, International Conference on Software Engineering, 2 June 2012]. You can get it from here:
http://research.microsoft.com/pubs/177124/p1064-213-deline.pdf
Channel 9 Video with Kael Rowan:
Kael has a very useful conversation about this on Channel 9.
Debugger Canvas