In the past we have discussed about another great Visual Studio 2010 extension, called Debugger Canvas.
Code Map on Debug Toolbar
Debug toolbar has been extended to include Code Map option. The new toolbar button for Code Map is displayed as in the image below. Like other debug options, the option is displayed but not enabled if there is no current debug session and the there is no breakpoint being hit.

The Debug toolbar can be selected using the following toolbar customization dialog. The dialog can be found in Tools -> Customize menu.

This can also be enabled by right clicking the toolbar area and selecting Debug option as follows:

Show Call Stack On Code Map - BreakPoint being hit
Visual Studio has always allowed showing the call stack at a breakpoint using Call Stack window. The Call Stack window is available in Debug -> Window -> Call Stack. The menu item is only available when a breakpoint is being hit. It shows the call hierarchy in a list. The top is the most current stack frame. We can double click a stack frame to go to the code definition. It can be used in conjunction with other debug windows including Locals, Autos, Immediate and Quick Watch windows to see the state of variables.
When a break point is currently being hit, there are various options introduced in Visual Stdio 2012.2 Ultimate to see the same call stack with a better visual experience i.e. in Code Map surface. The option in the debug toolbar for code map is enabled.

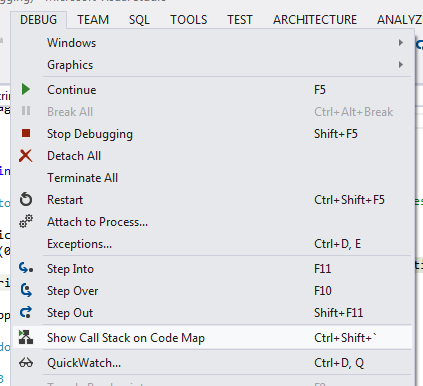
There are also other options available to show the same code map. One such option is from Debug menu. This menu item is only available when a break point is being hit. Clicking on the menu item should open the same code map call hierarchy.
We can also use Command Window to see the call stack in code map. A new command is provided in Visual Studio 2012.2 Ultimate just for this purpose. This command is Debug.ShowCallStackonCodeMap. As soon as we hit return after the statement, the graph is drawn on the map surface with the exact call hierarchy as you would otherwise see in Call Stack window.

You can see further details of this command in options dialog - keyboard settings. The default hot keys for the command with Visual C# 2005 keyboard settings is Ctrl + Shift + `. You can also see other commands added just to use this feature better.

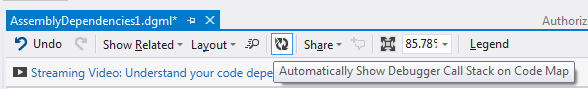
If we already have a graph created by adding the dependencies between elements in your solution, we can use the same graph to show the call hierarchy. The setting should automatically use the graph node for hitting the break point and showing the call stack. The setting is available in the header for graph window. The icon for the button could be improved. At first, I was thinking this is a Refresh button to update the graph with the code changes. I think Platform team can use the same icon as used in the debugger toolbar for Code Map. Anyway, this command should relieve you to hit the Show On Code Map button after a breakpoint is actually hit, the code map is already shown with the information for node where the current break point is being hit. It would make more sense to provide this in option settings instead of header of a document.
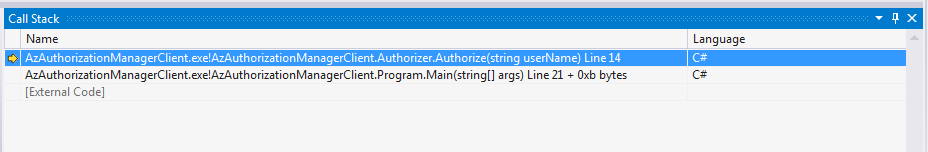
Irrespective of any option used to display code map of call hierarchy to current breakpoint, when a breakpoint is hit the same code map is displayed. For our Authorization client example, for the selected example, the code map for the call stack is displayed as follows:

Support of Other Debug Windows
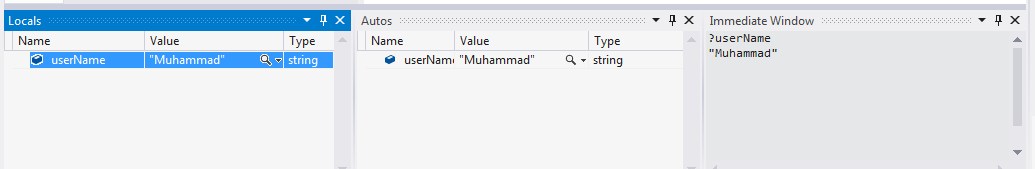
We can also use other debug windows while debugging use code map. Double clicking any node opens the stack frame code in a code editor window. Here we can use Locals, Immediate, Autos and other debug windows to see the exact values of parameters. In order to see the context of Locals and Autos windows you can see the context node as shows with a green sign as in the following image. The current break point node is shows with a yellow arrow pointing the node.

Here we have shown Autos, Locals and Immediate window. You can see the value of an argument, named userName.
Reuse of Code Map for multiple Debug Sessions
Code map also allows the same graph to be used during multiple debug sessions. This makes it easier to compare the call stack between multiple debug sessions. In the above call stack, we would like to see why even logs are not registered in the event store. Let's assume we get the following call stack in the first debug session.

By looking at the code we realize that there should be no call for RegisterAuthorizationLog from Main. It should actually be used directly by Authorize method. We update the code and start the debug session again. We insert a break point in RegisterAuthoriztionLog method. Now we get the updated call stack. In order to identify the current call hierarchy, you can only consider the red arrows. All the arrows from previous debugging sessions are grayed. Now you can see that the call hierarchy has actually been updated and you see the desired logs.

Comparison with Debugger Canvas
Code Map call stack can be compared with the actual call stack debug window and it stands out the comparison by providing the graphical layout of the actual call making it easier to understand the call hierarchy. But there is no comparison with Debugger Canvas extension. There are a lots of features in Debugger Canvas which has no parallel in Code Map Call stack. Debugger Canvas supports taking snapshot of arguments so if a method is called again we can compare the values, which is specially useful to look at recursive calls. The extension also has settings to reuse of the same graph and nodes or create a new graph in the same document file by adding a new channel. It supported better zoom support by double clicking the surface which only has limited support in Code Map. The code map is also not integrated with Intellitrace contrary to Debugger Canvas. Various options in Debugger Canvas can be controlled using options settings, there are no such settings for Code Map Call Stack.
Based on this comparison, we can assume that there would be a lot of improvements for Code Map debugging in the next Visual Studio Update. Let's hope for the best!!!


No comments:
Post a Comment