
Showing posts with label code map. Show all posts
Showing posts with label code map. Show all posts
Tuesday, April 23, 2013
Go To Definition Context menu for Assembly Node - 785179
We discussed about an issue of availability of "Go To Definition" context menu for assembly node on Code Map. The issue has been accepted as a bug by Microsoft. We can follow-up on this here:


Saturday, April 20, 2013
Visual Studio 2012.2 Code Map - Debugging Enhancements
Visual Studio 2012 Update 2 released earlier this month has included debugging support for Code Map. This is continued discussion about code map. Here we are discussing how debugging experience is affected and improved in current update feature.
In the past we have discussed about another great Visual Studio 2010 extension, called Debugger Canvas.
Code Map on Debug Toolbar
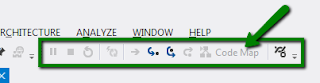
Debug toolbar has been extended to include Code Map option. The new toolbar button for Code Map is displayed as in the image below. Like other debug options, the option is displayed but not enabled if there is no current debug session and the there is no breakpoint being hit.
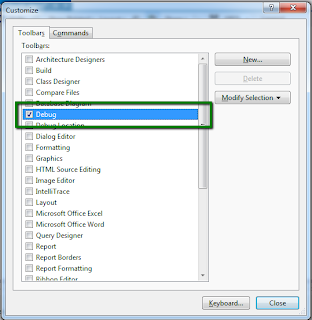
The Debug toolbar can be selected using the following toolbar customization dialog. The dialog can be found in Tools -> Customize menu.
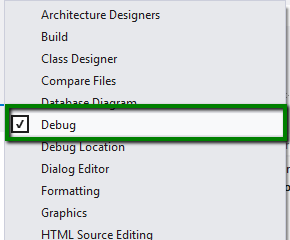
This can also be enabled by right clicking the toolbar area and selecting Debug option as follows:
Show Call Stack On Code Map - BreakPoint being hit
Visual Studio has always allowed showing the call stack at a breakpoint using Call Stack window. The Call Stack window is available in Debug -> Window -> Call Stack. The menu item is only available when a breakpoint is being hit. It shows the call hierarchy in a list. The top is the most current stack frame. We can double click a stack frame to go to the code definition. It can be used in conjunction with other debug windows including Locals, Autos, Immediate and Quick Watch windows to see the state of variables.

When a break point is currently being hit, there are various options introduced in Visual Stdio 2012.2 Ultimate to see the same call stack with a better visual experience i.e. in Code Map surface. The option in the debug toolbar for code map is enabled.

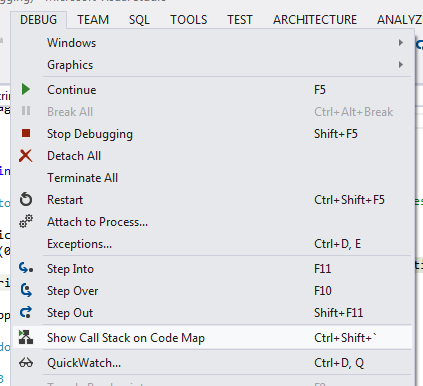
There are also other options available to show the same code map. One such option is from Debug menu. This menu item is only available when a break point is being hit. Clicking on the menu item should open the same code map call hierarchy.
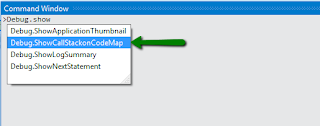
We can also use Command Window to see the call stack in code map. A new command is provided in Visual Studio 2012.2 Ultimate just for this purpose. This command is Debug.ShowCallStackonCodeMap. As soon as we hit return after the statement, the graph is drawn on the map surface with the exact call hierarchy as you would otherwise see in Call Stack window.
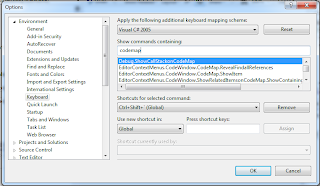
You can see further details of this command in options dialog - keyboard settings. The default hot keys for the command with Visual C# 2005 keyboard settings is Ctrl + Shift + `. You can also see other commands added just to use this feature better.
If we already have a graph created by adding the dependencies between elements in your solution, we can use the same graph to show the call hierarchy. The setting should automatically use the graph node for hitting the break point and showing the call stack. The setting is available in the header for graph window. The icon for the button could be improved. At first, I was thinking this is a Refresh button to update the graph with the code changes. I think Platform team can use the same icon as used in the debugger toolbar for Code Map. Anyway, this command should relieve you to hit the Show On Code Map button after a breakpoint is actually hit, the code map is already shown with the information for node where the current break point is being hit. It would make more sense to provide this in option settings instead of header of a document.

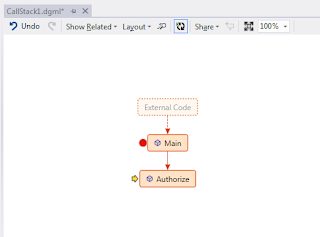
Irrespective of any option used to display code map of call hierarchy to current breakpoint, when a breakpoint is hit the same code map is displayed. For our Authorization client example, for the selected example, the code map for the call stack is displayed as follows:
Support of Other Debug Windows
We can also use other debug windows while debugging use code map. Double clicking any node opens the stack frame code in a code editor window. Here we can use Locals, Immediate, Autos and other debug windows to see the exact values of parameters. In order to see the context of Locals and Autos windows you can see the context node as shows with a green sign as in the following image. The current break point node is shows with a yellow arrow pointing the node.
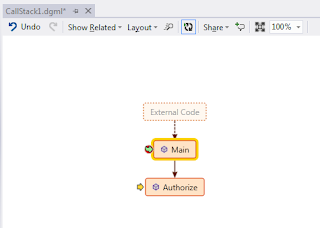
Here we have shown Autos, Locals and Immediate window. You can see the value of an argument, named userName.

Reuse of Code Map for multiple Debug Sessions
Code map also allows the same graph to be used during multiple debug sessions. This makes it easier to compare the call stack between multiple debug sessions. In the above call stack, we would like to see why even logs are not registered in the event store. Let's assume we get the following call stack in the first debug session.
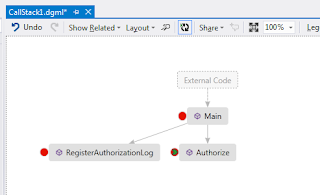
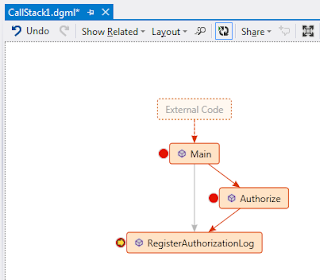
By looking at the code we realize that there should be no call for RegisterAuthorizationLog from Main. It should actually be used directly by Authorize method. We update the code and start the debug session again. We insert a break point in RegisterAuthoriztionLog method. Now we get the updated call stack. In order to identify the current call hierarchy, you can only consider the red arrows. All the arrows from previous debugging sessions are grayed. Now you can see that the call hierarchy has actually been updated and you see the desired logs.
Comparison with Debugger Canvas
Code Map call stack can be compared with the actual call stack debug window and it stands out the comparison by providing the graphical layout of the actual call making it easier to understand the call hierarchy. But there is no comparison with Debugger Canvas extension. There are a lots of features in Debugger Canvas which has no parallel in Code Map Call stack. Debugger Canvas supports taking snapshot of arguments so if a method is called again we can compare the values, which is specially useful to look at recursive calls. The extension also has settings to reuse of the same graph and nodes or create a new graph in the same document file by adding a new channel. It supported better zoom support by double clicking the surface which only has limited support in Code Map. The code map is also not integrated with Intellitrace contrary to Debugger Canvas. Various options in Debugger Canvas can be controlled using options settings, there are no such settings for Code Map Call Stack.
Based on this comparison, we can assume that there would be a lot of improvements for Code Map debugging in the next Visual Studio Update. Let's hope for the best!!!
In the past we have discussed about another great Visual Studio 2010 extension, called Debugger Canvas.
Code Map on Debug Toolbar
Debug toolbar has been extended to include Code Map option. The new toolbar button for Code Map is displayed as in the image below. Like other debug options, the option is displayed but not enabled if there is no current debug session and the there is no breakpoint being hit.

The Debug toolbar can be selected using the following toolbar customization dialog. The dialog can be found in Tools -> Customize menu.

This can also be enabled by right clicking the toolbar area and selecting Debug option as follows:

Show Call Stack On Code Map - BreakPoint being hit
Visual Studio has always allowed showing the call stack at a breakpoint using Call Stack window. The Call Stack window is available in Debug -> Window -> Call Stack. The menu item is only available when a breakpoint is being hit. It shows the call hierarchy in a list. The top is the most current stack frame. We can double click a stack frame to go to the code definition. It can be used in conjunction with other debug windows including Locals, Autos, Immediate and Quick Watch windows to see the state of variables.
When a break point is currently being hit, there are various options introduced in Visual Stdio 2012.2 Ultimate to see the same call stack with a better visual experience i.e. in Code Map surface. The option in the debug toolbar for code map is enabled.

There are also other options available to show the same code map. One such option is from Debug menu. This menu item is only available when a break point is being hit. Clicking on the menu item should open the same code map call hierarchy.
We can also use Command Window to see the call stack in code map. A new command is provided in Visual Studio 2012.2 Ultimate just for this purpose. This command is Debug.ShowCallStackonCodeMap. As soon as we hit return after the statement, the graph is drawn on the map surface with the exact call hierarchy as you would otherwise see in Call Stack window.

You can see further details of this command in options dialog - keyboard settings. The default hot keys for the command with Visual C# 2005 keyboard settings is Ctrl + Shift + `. You can also see other commands added just to use this feature better.

If we already have a graph created by adding the dependencies between elements in your solution, we can use the same graph to show the call hierarchy. The setting should automatically use the graph node for hitting the break point and showing the call stack. The setting is available in the header for graph window. The icon for the button could be improved. At first, I was thinking this is a Refresh button to update the graph with the code changes. I think Platform team can use the same icon as used in the debugger toolbar for Code Map. Anyway, this command should relieve you to hit the Show On Code Map button after a breakpoint is actually hit, the code map is already shown with the information for node where the current break point is being hit. It would make more sense to provide this in option settings instead of header of a document.
Irrespective of any option used to display code map of call hierarchy to current breakpoint, when a breakpoint is hit the same code map is displayed. For our Authorization client example, for the selected example, the code map for the call stack is displayed as follows:

Support of Other Debug Windows
We can also use other debug windows while debugging use code map. Double clicking any node opens the stack frame code in a code editor window. Here we can use Locals, Immediate, Autos and other debug windows to see the exact values of parameters. In order to see the context of Locals and Autos windows you can see the context node as shows with a green sign as in the following image. The current break point node is shows with a yellow arrow pointing the node.

Here we have shown Autos, Locals and Immediate window. You can see the value of an argument, named userName.
Reuse of Code Map for multiple Debug Sessions
Code map also allows the same graph to be used during multiple debug sessions. This makes it easier to compare the call stack between multiple debug sessions. In the above call stack, we would like to see why even logs are not registered in the event store. Let's assume we get the following call stack in the first debug session.

By looking at the code we realize that there should be no call for RegisterAuthorizationLog from Main. It should actually be used directly by Authorize method. We update the code and start the debug session again. We insert a break point in RegisterAuthoriztionLog method. Now we get the updated call stack. In order to identify the current call hierarchy, you can only consider the red arrows. All the arrows from previous debugging sessions are grayed. Now you can see that the call hierarchy has actually been updated and you see the desired logs.

Comparison with Debugger Canvas
Code Map call stack can be compared with the actual call stack debug window and it stands out the comparison by providing the graphical layout of the actual call making it easier to understand the call hierarchy. But there is no comparison with Debugger Canvas extension. There are a lots of features in Debugger Canvas which has no parallel in Code Map Call stack. Debugger Canvas supports taking snapshot of arguments so if a method is called again we can compare the values, which is specially useful to look at recursive calls. The extension also has settings to reuse of the same graph and nodes or create a new graph in the same document file by adding a new channel. It supported better zoom support by double clicking the surface which only has limited support in Code Map. The code map is also not integrated with Intellitrace contrary to Debugger Canvas. Various options in Debugger Canvas can be controlled using options settings, there are no such settings for Code Map Call Stack.
Based on this comparison, we can assume that there would be a lot of improvements for Code Map debugging in the next Visual Studio Update. Let's hope for the best!!!
Friday, April 19, 2013
Visual Studio 2012 Code Map - Visualizing Code Dependencies
Code Map has been integrated well with many tools in Visual Studio. In this post, are going to discuss the integration of code map with other tools in Visual Studio for visualizing code dependencies. The discussion would focus on the ease of understanding the code flow using code map. We have discussed other productivity tools in Visual studio to help going through the code better, Code Map is a great addition to our toolkit. I am sure there would be a heavy reliance on code map for code analysis and review purpose which is the topic of the discussion of this post.
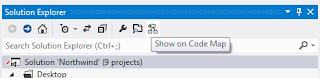
Solution Explorer Enhancement- Show on Code Map
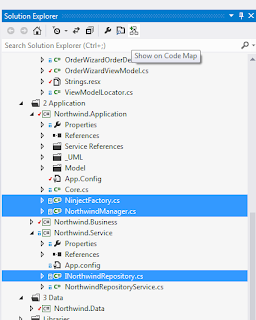
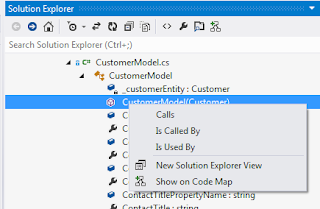
Visual Studio 2012 Solution explorer has been extended to enable the user to draw the code map based on the selection in solution explorer. As we know that Solution Explorer allows multiple selection, so we can select multiple files and hit Show on Code Map tool bar button in Solution explorer. Since Solution explorer allows us to navigate to classes and methods in a code file, we can even make more granular selection of methods and classes focusing on a particular area of code that we are interested in.
This option is specially useful when reviewing code for other team members. We can select all files committed by your mate and see their dependencies in the code map. Since solution explorer is an enhanced explorer in Visual Studio 2012, It allows us to select even individual classes in a file and their respective members including methods and properties.
Solution explorer context menu has also been extended to include Show on Code Map item. The menu considers the context of the selected items and makes the menu items available based on the type of selection. If it is a class then it allows to look at the inheritance hierarchy of a class as discussed in earlier posts about solution explorer enhancements in Visual Studio 2012. For methods, it allows to see the call hierarchy and references of these methods. But for all these code items, Show on Code Map item is always available which can be selected to add item to a new or existing code map.
Create Graph from Architecture Explorer
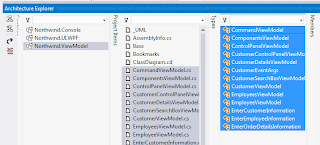
We can also create dependency graph on code map from architecture explorer. Architecture explorer allows us to navigate through the code to very deep level using the symbols without worrying about the actual code. We can create a new graph document or include the items in an already created graph document. The items are added to the graph using the new buttons shown in the architecture explorer available with Visual Studio 2012 Ultimate.
No Integration with Class View Explorer
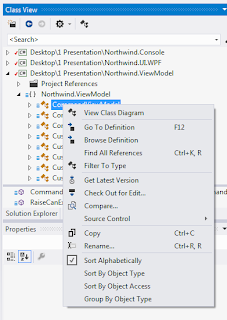
There is currently no integration of Code Map with Class View Explorer. As an example, let's look at the context menu shown for a class in Class View Explorer. There is no Show On Code Map that you might expect when you get used to it in Solution Explorer.
Code Map from Code Editor
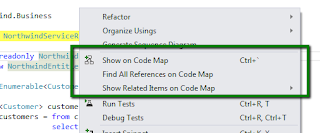
Code editors also allow us to view the dependency of an item in code map. We can just right click an item and select Show on Code Map from the context menu. This is actually a Visual Studio 2012.1 enhancement.
As we are going through the code we can keep adding the types, their members and containing assemblies on code map. The code map would keep adding them as nodes keeping the context of their containment relationship. This would also keep the dependencies between these nodes current.
Adding Graph Document To a Project
We can create dependency graph in two different ways. In the first approach we can create an empty graph document using Add New Item Dialog. This graph document is created in a project directly. When we save project then the item definition is also saved with the project. Saving all would save the graph and the project.
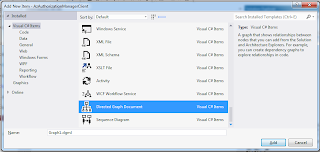
The other option is to keep adding items to the code map using Show On Code Map feature in various editors and tools in Visual Studio. The first time selection of this would create a new graph document with a default name if no graph has already been created. We can then move the graph document to a particular project by following the following menu:
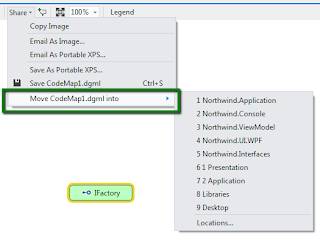
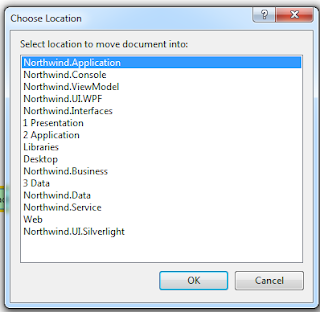
The above action would add the graph document to the top of project hierarchy. We can also create it in a sub folder within a project. You can notice the location menu above. Visual Studio first asks us to select the project where we need to add item then it opens file explorer to specify the location where the item would physically be saved.
Method Dependencies resolution In Code Map
Code map surface and editor allows various options to further explore deeper dependencies between items. The options are available as we select a node on the surface. Various context menu items are available based on the selected item. Here we have selected a method node, look at the various options available to explore dependencies of the selected method. Remember View Call Hierarchy tool discussed in previous posts? Now compare it to the sophisticated detailed options available here.
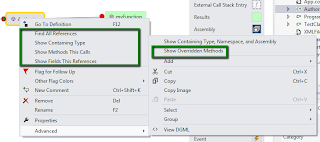
From the available options, we can select Show Methods This Calls. The selection would add additional nodes including the other methods called by the selected method.
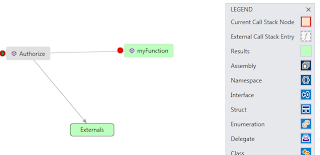
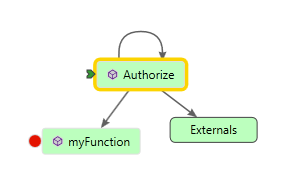
It can also show recursive calls . In the following method recursive call is displayed. Don't question me why would here be a recursive call. This is a bug which is highlighted for easier detection in this graphical format.

Type Dependencies Resolution In Code Map
This includes interface and concrete types. Code map supports showing the types in the inheritance hierarchy including base and derived classes, plus the interfaces that the type implements. We can also include the references of types referenced by / referencing this type. Code Map also supports to add the namespace and assembly that this type belongs to.
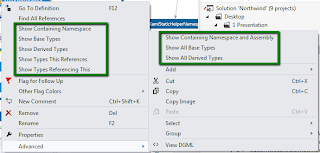
The same menu items are available in Show Related menu.

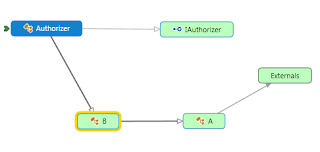
We can select to show base class. For a class, it will show the base class inherited and the implemented interfaces. In this example we have selected to show the base types of Authorizer class. It implements IAuthorizer class. Since all types implicitly inherit from System.Object, it is also shown in the graph.
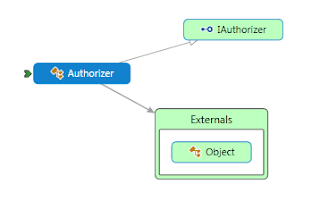
Show All Base Types shows all the types in the inheritance relationship all the way to System.Object. The opposite is Show All Derived Types, which shows all the types in the inheritance hierarchy.
Drag & Drop On Code Map Surface
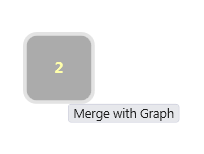
Code Map also supports dragging items from Solution Explorer on a Graph. We can even select multiple items from solution explorer and drop it on the surface. They can even be different types i.e. we can select a combination of methods and types for such drag and drop. What we cannot do is the multiple selection of items from different project and drop all of them on a graph surface. Before you drop the items on graph surface, it shows you the number of items being dragged.
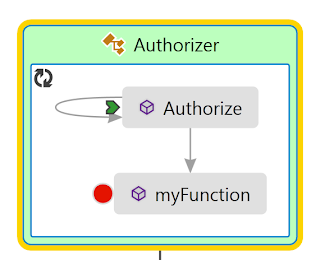
The items are merged with the items already existing on a graph. In the following, we already had Authorize method node on graph. Then we added its containing type Authorizer on the surface. Code map does the necessary merging showing the method as contained by the type and expands the class node to show the merging.
Go To Definition
Code Map support navigating to the code definition anytime we select the node. This navigation option can be selected from the context menu of a node for a type or its member. This is the same Go To Definition available from code editor and you might already be used to using F12 for going to definition for the item currently under the cursor. Just select a node and hit F12 to go the definition of the selected node.
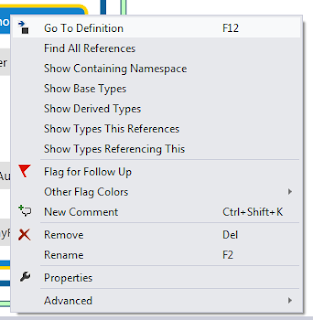
Strangely this option is also available for an Assembly node as well. When clicked, the context menu is just closed and no action happens. Ideally, I would expect this option not to be available in context menu items list as the context doesn't require so. I have submitted this as a bug on Connect, let's see what Visual Studio Platform team thinks about it. Just vote for it if you think that this option should be removed from here.

Solution Explorer Enhancement- Show on Code Map
Visual Studio 2012 Solution explorer has been extended to enable the user to draw the code map based on the selection in solution explorer. As we know that Solution Explorer allows multiple selection, so we can select multiple files and hit Show on Code Map tool bar button in Solution explorer. Since Solution explorer allows us to navigate to classes and methods in a code file, we can even make more granular selection of methods and classes focusing on a particular area of code that we are interested in.

This option is specially useful when reviewing code for other team members. We can select all files committed by your mate and see their dependencies in the code map. Since solution explorer is an enhanced explorer in Visual Studio 2012, It allows us to select even individual classes in a file and their respective members including methods and properties.

Solution explorer context menu has also been extended to include Show on Code Map item. The menu considers the context of the selected items and makes the menu items available based on the type of selection. If it is a class then it allows to look at the inheritance hierarchy of a class as discussed in earlier posts about solution explorer enhancements in Visual Studio 2012. For methods, it allows to see the call hierarchy and references of these methods. But for all these code items, Show on Code Map item is always available which can be selected to add item to a new or existing code map.

Create Graph from Architecture Explorer
We can also create dependency graph on code map from architecture explorer. Architecture explorer allows us to navigate through the code to very deep level using the symbols without worrying about the actual code. We can create a new graph document or include the items in an already created graph document. The items are added to the graph using the new buttons shown in the architecture explorer available with Visual Studio 2012 Ultimate.

No Integration with Class View Explorer
There is currently no integration of Code Map with Class View Explorer. As an example, let's look at the context menu shown for a class in Class View Explorer. There is no Show On Code Map that you might expect when you get used to it in Solution Explorer.

Code Map from Code Editor
Code editors also allow us to view the dependency of an item in code map. We can just right click an item and select Show on Code Map from the context menu. This is actually a Visual Studio 2012.1 enhancement.

As we are going through the code we can keep adding the types, their members and containing assemblies on code map. The code map would keep adding them as nodes keeping the context of their containment relationship. This would also keep the dependencies between these nodes current.
Adding Graph Document To a Project
We can create dependency graph in two different ways. In the first approach we can create an empty graph document using Add New Item Dialog. This graph document is created in a project directly. When we save project then the item definition is also saved with the project. Saving all would save the graph and the project.

The other option is to keep adding items to the code map using Show On Code Map feature in various editors and tools in Visual Studio. The first time selection of this would create a new graph document with a default name if no graph has already been created. We can then move the graph document to a particular project by following the following menu:

The above action would add the graph document to the top of project hierarchy. We can also create it in a sub folder within a project. You can notice the location menu above. Visual Studio first asks us to select the project where we need to add item then it opens file explorer to specify the location where the item would physically be saved.

Method Dependencies resolution In Code Map
Code map surface and editor allows various options to further explore deeper dependencies between items. The options are available as we select a node on the surface. Various context menu items are available based on the selected item. Here we have selected a method node, look at the various options available to explore dependencies of the selected method. Remember View Call Hierarchy tool discussed in previous posts? Now compare it to the sophisticated detailed options available here.

From the available options, we can select Show Methods This Calls. The selection would add additional nodes including the other methods called by the selected method.

It can also show recursive calls . In the following method recursive call is displayed. Don't question me why would here be a recursive call. This is a bug which is highlighted for easier detection in this graphical format.


Type Dependencies Resolution In Code Map
This includes interface and concrete types. Code map supports showing the types in the inheritance hierarchy including base and derived classes, plus the interfaces that the type implements. We can also include the references of types referenced by / referencing this type. Code Map also supports to add the namespace and assembly that this type belongs to.

The same menu items are available in Show Related menu.

We can select to show base class. For a class, it will show the base class inherited and the implemented interfaces. In this example we have selected to show the base types of Authorizer class. It implements IAuthorizer class. Since all types implicitly inherit from System.Object, it is also shown in the graph.

Show All Base Types shows all the types in the inheritance relationship all the way to System.Object. The opposite is Show All Derived Types, which shows all the types in the inheritance hierarchy.

Drag & Drop On Code Map Surface
Code Map also supports dragging items from Solution Explorer on a Graph. We can even select multiple items from solution explorer and drop it on the surface. They can even be different types i.e. we can select a combination of methods and types for such drag and drop. What we cannot do is the multiple selection of items from different project and drop all of them on a graph surface. Before you drop the items on graph surface, it shows you the number of items being dragged.

The items are merged with the items already existing on a graph. In the following, we already had Authorize method node on graph. Then we added its containing type Authorizer on the surface. Code map does the necessary merging showing the method as contained by the type and expands the class node to show the merging.

Go To Definition
Code Map support navigating to the code definition anytime we select the node. This navigation option can be selected from the context menu of a node for a type or its member. This is the same Go To Definition available from code editor and you might already be used to using F12 for going to definition for the item currently under the cursor. Just select a node and hit F12 to go the definition of the selected node.

Strangely this option is also available for an Assembly node as well. When clicked, the context menu is just closed and no action happens. Ideally, I would expect this option not to be available in context menu items list as the context doesn't require so. I have submitted this as a bug on Connect, let's see what Visual Studio Platform team thinks about it. Just vote for it if you think that this option should be removed from here.

Monday, April 15, 2013
Tips & Tricks: Visual Studio 2012 - Code Flow Navigation Using CodeMap - Project Dependencies
Code Map is a new Visual Studio 2012 feature which provides ability to navigate through the code by adding various visualization related support in Visual Studio. In this post we are discussing how code map helps us looking at the dependencies of projects in a solution and how it makes it easier to determine the external dependencies of a project or all projects in a solution.
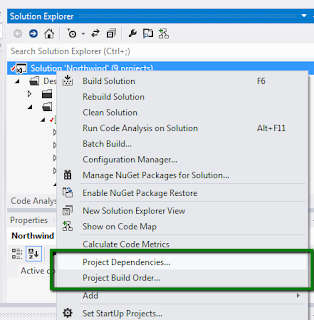
Let's first look how code map helps us understanding the dependencies between projects in a solution. Visual Studio Solution Explorer allows us to see the dependencies of an individual project. It also allows us to view the build order of projects in a solution. The build order depends on project dependencies. Right click a project in Solution Explorer and you should see the following view:
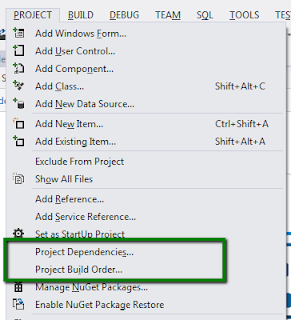
The same option can be found in main menu. Just navigate through the Project menu as follows:
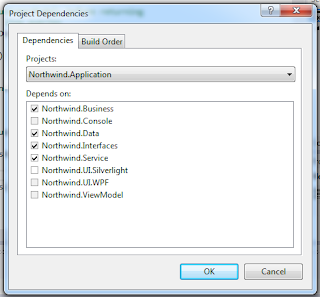
Selecting Project Dependencies from the context menu shows the following dialog. It displays the project's dependencies with other projects in the same solution. While we are here on this dialog, we can select any other project from the drop down and see its dependencies. We can also specify more dependencies. These dependencies would have an effect on build order, as well, discussed next.
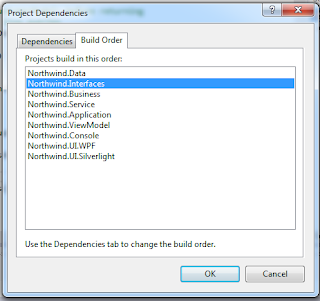
The build order is affected by project dependencies. It's actually the other tab on the same dialog. We could directly come to this using the context menu shows before available for a project in solution explorer.
There is no way we can see the dependencies of project in a solution and with the external libraries (assemblies) in a single view. This gets really frustrating for more complex solutions involving many projects.
Project Dependencies Using Code Map
Let's see how code map helps making this job easier for us i.e. determining the dependencies of projects in a solution on each other and on external libraries. Please remember that Code map feature is not available in Visual Studio 2012 express edition. The full featured Code Map is only available in Visual Studio 2012 Ultimate Edition. Visual Studio 2012 Premium and Professional editions also allow limited read-only code map support.
If you have Visual Studio 2012 Ultimate edition, you should be able to find the following menu item. Actually this is the only step we need to generate dependencies between project assemblies.
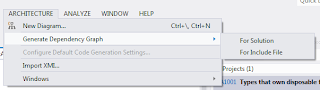
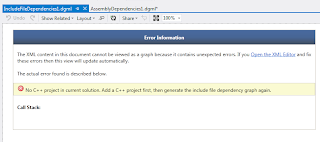
Here Include File is available to support C++ projects. Since we don't have a C++ project in our solution, we see the following message if we select Include File option:
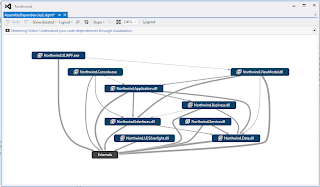
Selecting For Solution displays the dependencies between projects in a solution. The map is generated on a Pan & Zoom surface which can be dragged in any direction. Double clicking the view should zoom in which can also be done using the mouse wheel. There are other zoom options available on the view as well. It has a single node with title as Externals. This refers to the external libraries referred by all the projects. I think this is better than providing a separate Externals window for each project because that would just clutter the view without providing any extra help. We just need to see what external libraries our application depends upon and one node serves the purpose for this.
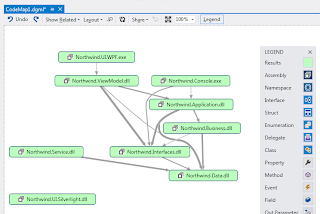
A similar map can be generated using the solution explorer. We can right click the solution file in the solution explorer and select Show on Code Map. Alternatively, we can select the new Show On Code Map button in Context Menu. The difference is that it would just show the dependencies between projects in the solution, hence no external dependency would be shown here. You can also notice the assembly nodes in light green. This is general convention in Visual Studio for code map that the results are shown in this color code. You can change the color in the Legend tool window.
We can clear the highlighting by using the following Layout menu. It updates the graph node to the original node format with the default icons.
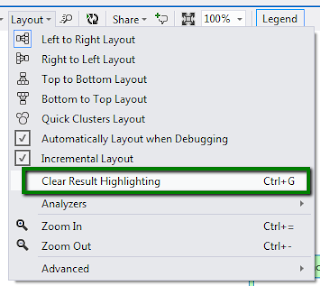
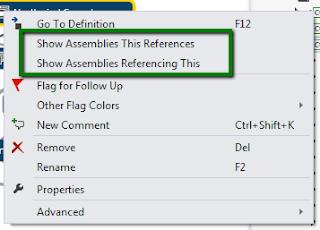
If we add more assemblies in the solution and add references to the existing projects, we can update the new references from the context menu by selecting the assemblies. We can also show all the assemblies which references the current assemblies.
Yes this is direct graph where dependencies are shows with a single arrow. The head of arrow is towards the dependee side.

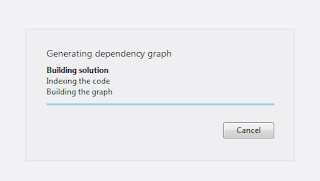
It might take some time to generate the graph depending on the size of your solution. For my solution, it just took a few seconds to generate the graph for showing the dependencies between projects in the solution. But it shows meaningful status messages as follows:
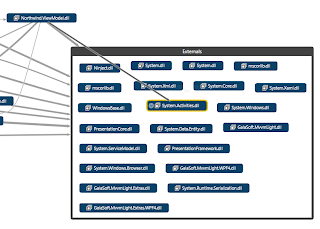
If we need to see which projects depend on a particular external library, we can just expand the Externals node. Just expanding the externals node would display all the external libraries used by the current solution. Select a particular external library and you should see all the projects depending on it. The dependency is shown by directed arrow towards this external library. In our Northwind solution, only the view model project is depending on Workflow API as we have an example for controlling the application flow using Windows WF. This is part of Workflow chapter of the book.
We can see the dependencies of a project. Here Northwind.ViewModel is dependent upon Northwind.Interfaces, Northwind.Application and external libraries. It is also a target of dependency for Northwind.UI.WPF.
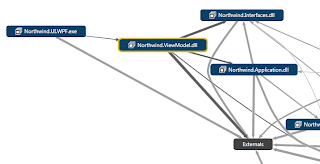
Dependency Analyzers
In order to make our life more beautiful, the map also supports analyzers. We can see which of these assemblies are not directly referenced by any other assemblies. This is achieved through Unreferenced Nodes analyzers. We can also see which of these assemblies are hubs. According to Visual Studio hubs are nodes which are top 10% referenced node in the graph. This can be added in the map using Hubs analyzer. The map also supports circular dependency analysis using Circular References Analyzer.
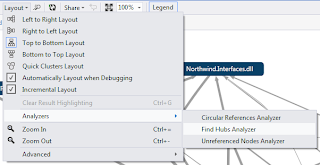
Here is the definition of Hub nodes in Code Map. They are 10% of highly connected nodes.

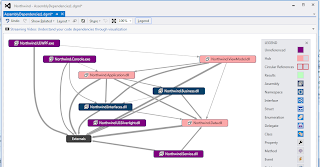
Adding all these analyzers would update the code map of Northwind example project as follows. We can also include Legend to determine and possibly change the color coding for the convention. It seems that Unreferenced Nodes analyzer takes precedence over Hubs analyzer as the nodes which are hub and unreferenced nodes simultaneously, they are shown with Unreferenced color coding.
Editing DGML file [xml)
The dependencies between projects are generated using DGML [Directed Graph Markup Language]. This was introduced with Visual Studio 2010. We can view the DGML file for the dependencies between projects by following through the context menu available for the solution.
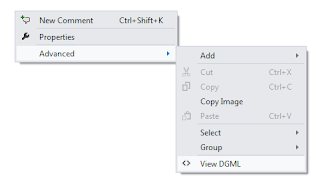
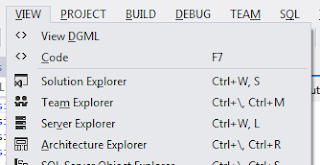
Alternatively we can view DGML of a graph by the following menu items available in View Menu. The menu item is available when a graph is currently being displayed in Visual Studio.
For Northwind MVVM project, the dependencies between projects is generated as follows:
Visual Studio also supports creating schema for an xml document. Just follow the following menu:
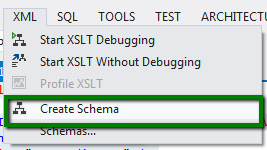
The following schema is generated. Please remember that this is not the actual schema for the DGML format. It is just generated based on the data in the current DGML file.
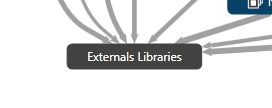
We can also edit the generated DGML file. The updates in DGML should be reflected in the visual map for dependencies between projects. Here we have update the Label of Externals node to Externals Libraries and the update is propagated to the visual map.
Sharing Map with Team
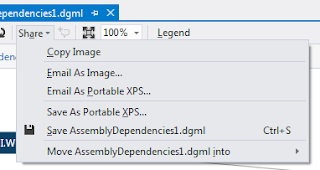
The map can also be shared across the team. We can copy it as an image and paste it for creating design documents. This can also be saved in XPS format for saving it and later viewing in image format. Visual Studio also supports directly attaching it to email and opens the default email client for you.
Tooltip for Dependencies
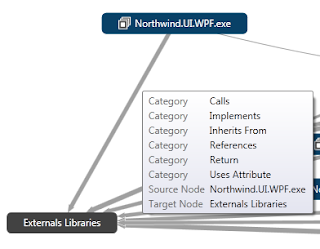
Code map also provides tooltip on the arrows describing he dependencies between source and target nodes. The dependencies are shown as categories. It also specifies the information about source and target nodes. This is really handy for complex maps. Here we are using the tooltip for dependency between Northwind.UI.WPF and External Libraries.
Namespaces and Types in an Assembly
Generally when we need to see the list of namespaces and types available in an assembly we take the help of Object Browser in Visual Studio. Below we have expanded Northwind.ViewModel assembly. Look at the details of expansion allowing us to dig as we seem necessary. When we expand the assembly node, it shows us the namespaces defined in an assembly and the relationships for the types in those namespaces. We can further expand it to see the types available in a namespace. If we are interested to see the details of members in a type, we just expand the type node. Hovering over a method shows the details about the method in a tooltip.
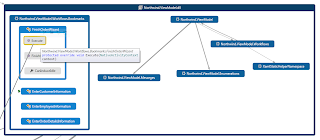
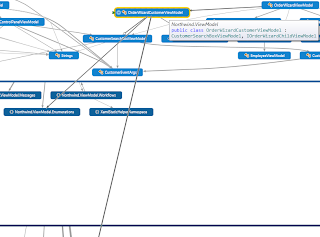
If there is any dependencies between types, it would show the dependencies between types. It would show the details in the similar tooltips. Here we see the types in Northwind.ViewModel namespace and the relationship between the containing types.

The code map shows the relationship between these types. It would also show the dependencies with other types in the same / different namespaces. It would also show the exact dependencies between typed in different assemblies. All of this is shown when we select a type in code map.
Updating Map with Code
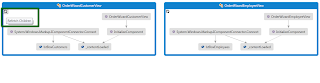
Since Code map is the map of some code, it has to keep updated with the code. If you think any particular node needs to be refreshed, you can always re-fetch its children. Let's look at the following button on a container node.
Expanding Contributing Links
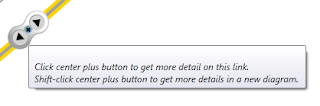
Code map allows to see the details of the links providing more insight into the dependencies. Clicking on the dependencies link shows the following options. This allows to navigate between source and target nodes, plus we can expand the nodes to see more dependencies between nodes.
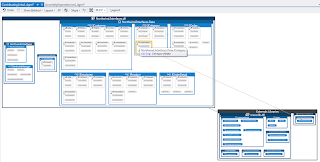
Here we have selected to see the dependencies between assemblies in a separate window for and Northwind.Interfaces and External Libraries. Selecting a particular type shows the exact details of dependency.
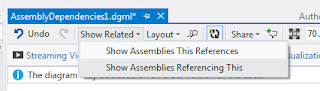
Showing Related Assemblies
If some related assembly references are missing then code map supports adding them. Just follow the following menu.
Let's first look how code map helps us understanding the dependencies between projects in a solution. Visual Studio Solution Explorer allows us to see the dependencies of an individual project. It also allows us to view the build order of projects in a solution. The build order depends on project dependencies. Right click a project in Solution Explorer and you should see the following view:

The same option can be found in main menu. Just navigate through the Project menu as follows:

Selecting Project Dependencies from the context menu shows the following dialog. It displays the project's dependencies with other projects in the same solution. While we are here on this dialog, we can select any other project from the drop down and see its dependencies. We can also specify more dependencies. These dependencies would have an effect on build order, as well, discussed next.

The build order is affected by project dependencies. It's actually the other tab on the same dialog. We could directly come to this using the context menu shows before available for a project in solution explorer.

There is no way we can see the dependencies of project in a solution and with the external libraries (assemblies) in a single view. This gets really frustrating for more complex solutions involving many projects.
Project Dependencies Using Code Map
Let's see how code map helps making this job easier for us i.e. determining the dependencies of projects in a solution on each other and on external libraries. Please remember that Code map feature is not available in Visual Studio 2012 express edition. The full featured Code Map is only available in Visual Studio 2012 Ultimate Edition. Visual Studio 2012 Premium and Professional editions also allow limited read-only code map support.
If you have Visual Studio 2012 Ultimate edition, you should be able to find the following menu item. Actually this is the only step we need to generate dependencies between project assemblies.

Here Include File is available to support C++ projects. Since we don't have a C++ project in our solution, we see the following message if we select Include File option:

Selecting For Solution displays the dependencies between projects in a solution. The map is generated on a Pan & Zoom surface which can be dragged in any direction. Double clicking the view should zoom in which can also be done using the mouse wheel. There are other zoom options available on the view as well. It has a single node with title as Externals. This refers to the external libraries referred by all the projects. I think this is better than providing a separate Externals window for each project because that would just clutter the view without providing any extra help. We just need to see what external libraries our application depends upon and one node serves the purpose for this.

A similar map can be generated using the solution explorer. We can right click the solution file in the solution explorer and select Show on Code Map. Alternatively, we can select the new Show On Code Map button in Context Menu. The difference is that it would just show the dependencies between projects in the solution, hence no external dependency would be shown here. You can also notice the assembly nodes in light green. This is general convention in Visual Studio for code map that the results are shown in this color code. You can change the color in the Legend tool window.

We can clear the highlighting by using the following Layout menu. It updates the graph node to the original node format with the default icons.

If we add more assemblies in the solution and add references to the existing projects, we can update the new references from the context menu by selecting the assemblies. We can also show all the assemblies which references the current assemblies.

Yes this is direct graph where dependencies are shows with a single arrow. The head of arrow is towards the dependee side.

It might take some time to generate the graph depending on the size of your solution. For my solution, it just took a few seconds to generate the graph for showing the dependencies between projects in the solution. But it shows meaningful status messages as follows:

If we need to see which projects depend on a particular external library, we can just expand the Externals node. Just expanding the externals node would display all the external libraries used by the current solution. Select a particular external library and you should see all the projects depending on it. The dependency is shown by directed arrow towards this external library. In our Northwind solution, only the view model project is depending on Workflow API as we have an example for controlling the application flow using Windows WF. This is part of Workflow chapter of the book.

We can see the dependencies of a project. Here Northwind.ViewModel is dependent upon Northwind.Interfaces, Northwind.Application and external libraries. It is also a target of dependency for Northwind.UI.WPF.

Dependency Analyzers
In order to make our life more beautiful, the map also supports analyzers. We can see which of these assemblies are not directly referenced by any other assemblies. This is achieved through Unreferenced Nodes analyzers. We can also see which of these assemblies are hubs. According to Visual Studio hubs are nodes which are top 10% referenced node in the graph. This can be added in the map using Hubs analyzer. The map also supports circular dependency analysis using Circular References Analyzer.

Here is the definition of Hub nodes in Code Map. They are 10% of highly connected nodes.

Adding all these analyzers would update the code map of Northwind example project as follows. We can also include Legend to determine and possibly change the color coding for the convention. It seems that Unreferenced Nodes analyzer takes precedence over Hubs analyzer as the nodes which are hub and unreferenced nodes simultaneously, they are shown with Unreferenced color coding.

Editing DGML file [xml)
The dependencies between projects are generated using DGML [Directed Graph Markup Language]. This was introduced with Visual Studio 2010. We can view the DGML file for the dependencies between projects by following through the context menu available for the solution.

Alternatively we can view DGML of a graph by the following menu items available in View Menu. The menu item is available when a graph is currently being displayed in Visual Studio.

For Northwind MVVM project, the dependencies between projects is generated as follows:
Visual Studio also supports creating schema for an xml document. Just follow the following menu:

The following schema is generated. Please remember that this is not the actual schema for the DGML format. It is just generated based on the data in the current DGML file.
We can also edit the generated DGML file. The updates in DGML should be reflected in the visual map for dependencies between projects. Here we have update the Label of Externals node to Externals Libraries and the update is propagated to the visual map.

Sharing Map with Team
The map can also be shared across the team. We can copy it as an image and paste it for creating design documents. This can also be saved in XPS format for saving it and later viewing in image format. Visual Studio also supports directly attaching it to email and opens the default email client for you.

Tooltip for Dependencies
Code map also provides tooltip on the arrows describing he dependencies between source and target nodes. The dependencies are shown as categories. It also specifies the information about source and target nodes. This is really handy for complex maps. Here we are using the tooltip for dependency between Northwind.UI.WPF and External Libraries.

Namespaces and Types in an Assembly
Generally when we need to see the list of namespaces and types available in an assembly we take the help of Object Browser in Visual Studio. Below we have expanded Northwind.ViewModel assembly. Look at the details of expansion allowing us to dig as we seem necessary. When we expand the assembly node, it shows us the namespaces defined in an assembly and the relationships for the types in those namespaces. We can further expand it to see the types available in a namespace. If we are interested to see the details of members in a type, we just expand the type node. Hovering over a method shows the details about the method in a tooltip.

If there is any dependencies between types, it would show the dependencies between types. It would show the details in the similar tooltips. Here we see the types in Northwind.ViewModel namespace and the relationship between the containing types.

The code map shows the relationship between these types. It would also show the dependencies with other types in the same / different namespaces. It would also show the exact dependencies between typed in different assemblies. All of this is shown when we select a type in code map.

Updating Map with Code
Since Code map is the map of some code, it has to keep updated with the code. If you think any particular node needs to be refreshed, you can always re-fetch its children. Let's look at the following button on a container node.

Expanding Contributing Links
Code map allows to see the details of the links providing more insight into the dependencies. Clicking on the dependencies link shows the following options. This allows to navigate between source and target nodes, plus we can expand the nodes to see more dependencies between nodes.

Here we have selected to see the dependencies between assemblies in a separate window for and Northwind.Interfaces and External Libraries. Selecting a particular type shows the exact details of dependency.

Showing Related Assemblies
If some related assembly references are missing then code map supports adding them. Just follow the following menu.

Subscribe to:
Posts (Atom)


