Like other debugging tools, we can add break-points in our T-SQL code. Pressing F9 would add the break-point as generally is the standard in other Microsoft tools.
There are different windows available for debugging the code. The windows include:
1. 'Local'
2. 'Call Stack'
3. 'Output'
4. 'Command Window'
5. 'Threads'
6. 'BreakPoints'
7. 'Watch'
You can 'Step Into', 'Step Out' or 'Step Over' the code. There are same short-cut keys available as in other Microsoft tools.
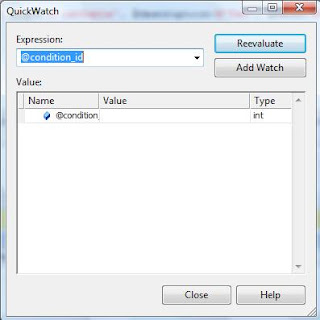
The 'Quick Watch' feature is also available. With this feature, you can evaluate any expression evaluated under the environment of execution of current code.

You can also toggle, delete or disable breakpoints.
Enjoy this feature!


No comments:
Post a Comment