Showing posts with label Visual Studio 2012 Update 2. Show all posts

Thursday, April 25, 2013

Visual Studio 2012 - Debug T4 Template

T4 is the acronym for Text Template Transformation Toolkit. People have always claimed T4 templates as a hidden gem from Microsoft. They are used by Asp.net MVC and Entity Framework to generate code elements including controller and model classes. Visual Studio 2012 supports debugging T4 templates. They can be debugged at design time. In this post we are creating a very simple application in WPF to discuss how to use this in Visual Studio 2012. In the example we are adding a text template to add a file based on application settings in App.Config in a project. The template would introduce a new class ApplicationProperties. This would hold properties for each setting added in the settings section. For simplicity, let's keep the data type of all these properties as string.


For this example we need to add assembly reference for System.Configuration assembly. This would allow us reading the configuration settings from App.config file for the project.


Let's add a text template to the project. We name the template as ApplicationProperties.tt.


Now we add template code in ApplicationProperties.tt file. We need to update the definition of the text template.


If your eyes just popped, put it back in its real place. Syntax Highlighting is still not supported in Visual Studio 2012. I know community has strong opinions about this and the absence of intellisense for template editor. Still not supported. Here I am using the Devart extension for T4 template. It adds syntax highlighting and intellisense for T4 templates.


The line numbers can be included by updating the setting for extension. The following is added to Options & Settings dialog. Checking the option would include the line numbers on a T4 editor.


The T4 template is added to the project definition [CSProj]. The resulting CS file is added to the item group for compilation. It is dependent on and automatically generated from the actual Text Template [TT] file at design time.


Let's update the definition of ApplicationSettings.tt to include the code generation logic. It starts with adding directives for template, output, assembly and import directives. The rest of the code reads App.Config and generates properties for all the app settings.

The code uses Host.ResolvePath to get the path for App.Config. It then reads the content in an XmlDocument class. If there are no such settings it uses Error utility method defined in TextTemplatingFileGenerator custom tool. Saving the template file should result in the following error message.


Let's assume that this template was given to us and we need to determine what we need to do to fix this problem. Let' us put some breakpoints in the template code. Visual Studio supports inserting breakpoints and trace points in the template code as well. If we right click the template file in solution explorer, please notice the additional Debug T4 Template option available. Let's try to debug the text template to determine the cause of error message. Add some breakpoints to the template code. You can read about using break points & developer productivity in one of our previous discussion.


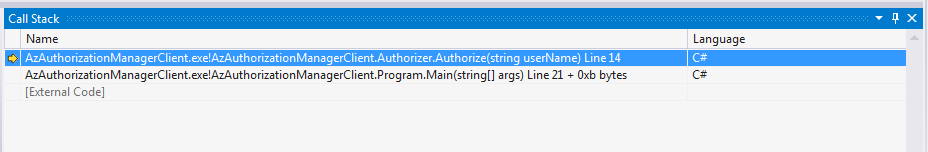
As we debug the template, we notice that the breakpoints are being hit. We can also notice that the debugging experience is integrated with other debugging windows available in Visual Studio including Quick Watch, Immediate and Locals windows.


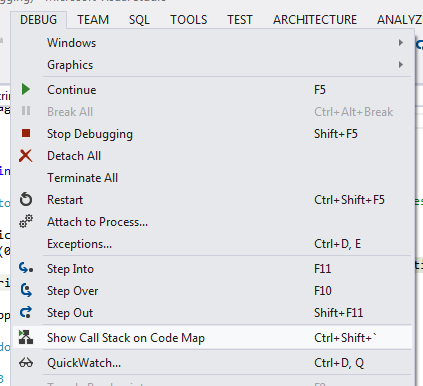
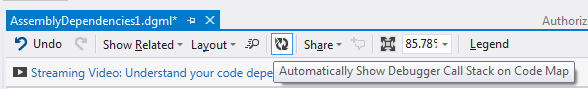
In the previous posts we have been discussing about code map to visualize and debug code in Visual Studio 2012. The feature also seem to completely work with T4 template debugging. Since Code map is only supported for code visualization for C# and VB code, we wouldn't be able to navigate the code graphically to understand it better.


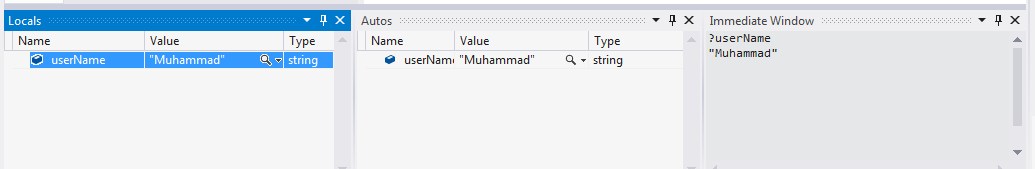
The Autos window seems to be broken in Visual Studio 2012.2 Ultimate. Please notice that it is empty even though the control has already passed through some variable declarations. It should have included document variable on the window to display its value.


The template editor still doesn't provide any refactoring support. So if you change a variable name, make sure that you propagate the changes to all the places in the code where it is being used. Although we see the error messages as reported by Error utility method in Errors List window but double clicking the error message wouldn't open the editor and navigate to the line where the error came from. It still shows the line number and template document name name in the errors list window, which is also not very useful as the line numbers are not from template document itself.


Anyhow, we realize that it needs the application settings to be defined in App.Config settings. Please notice the empty collection here.


We must remember that any error while running the custom tool on the template would not stop it at the line where the error is found but it continues and report all errors and warnings in the template. So the C# code file is still generated for application properties. Any error in the document also wouldn't fail the project build.


Let's update the App.Config to include some application setting entries. Here we are adding three properties AppTitle, ReleaseType and ReleaseVersion. They are assigned with their respective values.

As soon as we add these settings and run the custom tool from the context menu for T4 template from solution explorer, we can see the new properties being added to the generated class in solution explorer. We can also notice that the errors list is empty now.


The generated ApplicationProperties static class is also updated to include the new properties. Now as we add or update a setting in App.Config, a new property is automatically added to the generated class as the tool is run.

We can also run Custom tool from Project Menu. The following menu is available if we have a template selected in Solution Explorer.


We don't need to run each template individually. We can run the custom tools for all the templates in a solution. We need to add build toolbar in Visual Studio 2012 and use the following toolbar button to run these transformations.


There used to be this option in Visual Studio 2010 which is added when there is a T4 template added to a project in the solution opened in the Visual Studio editor. I can't seem to find the option in Visual Studio 2012.


Let's update our example Application's Main window to use the properties generated from the class generated from T4 template. Here we are using AppTitle, ReleaseType and ReleaseVersion as included in App.Config.

The application builds fine. The MainWindow appears on the screen being the startup window for the application. We can verify that all the values match as we declared them in App.Config.


Download Code


Tuesday, April 23, 2013

Go To Definition Context menu for Assembly Node - 785179

We discussed about an issue of availability of "Go To Definition" context menu for assembly node on Code Map. The issue has been accepted as a bug by Microsoft. We can follow-up on this here:

Saturday, April 20, 2013

Visual Studio 2012.2 Code Map - Debugging Enhancements

Visual Studio 2012 Update 2 released earlier this month has included debugging support for Code Map. This is continued discussion about code map. Here we are discussing how debugging experience is affected and improved in current update feature.

In the past we have discussed about another great Visual Studio 2010 extension, called Debugger Canvas.

Code Map on Debug Toolbar
Debug toolbar has been extended to include Code Map option. The new toolbar button for Code Map is displayed as in the image below. Like other debug options, the option is displayed but not enabled if there is no current debug session and the there is no breakpoint being hit.


The Debug toolbar can be selected using the following toolbar customization dialog. The dialog can be found in Tools -> Customize menu.


This can also be enabled by right clicking the toolbar area and selecting Debug option as follows:


Show Call Stack On Code Map - BreakPoint being hit
Visual Studio has always allowed showing the call stack at a breakpoint using Call Stack window. The Call Stack window is available in Debug -> Window -> Call Stack. The menu item is only available when a breakpoint is being hit. It shows the call hierarchy in a list. The top is the most current stack frame. We can double click a stack frame to go to the code definition. It can be used in conjunction with other debug windows including Locals, Autos, Immediate and Quick Watch windows to see the state of variables.


When a break point is currently being hit, there are various options introduced in Visual Stdio 2012.2 Ultimate to see the same call stack with a better visual experience i.e. in Code Map surface. The option in the debug toolbar for code map is enabled.


There are also other options available to show the same code map. One such option is from Debug menu. This menu item is only available when a break point is being hit. Clicking on the menu item should open the same code map call hierarchy.


We can also use Command Window to see the call stack in code map. A new command is provided in Visual Studio 2012.2 Ultimate just for this purpose. This command is Debug.ShowCallStackonCodeMap. As soon as we hit return after the statement, the graph is drawn on the map surface with the exact call hierarchy as you would otherwise see in Call Stack window.


You can see further details of this command in options dialog - keyboard settings. The default hot keys for the command with Visual C# 2005 keyboard settings is Ctrl + Shift + `. You can also see other commands added just to use this feature better.


If we already have a graph created by adding the dependencies between elements in your solution, we can use the same graph to show the call hierarchy. The setting should automatically use the graph node for hitting the break point and showing the call stack. The setting is available in the header for graph window. The icon for the button could be improved. At first, I was thinking this is a Refresh button to update the graph with the code changes. I think Platform team can use the same icon as used in the debugger toolbar for Code Map. Anyway, this command should relieve you to hit the Show On Code Map button after a breakpoint is actually hit, the code map is already shown with the information for node where the current break point is being hit. It would make more sense to provide this in option settings instead of header of a document.


Irrespective of any option used to display code map of call hierarchy to current breakpoint, when a breakpoint is hit the same code map is displayed. For our Authorization client example, for the selected example, the code map for the call stack is displayed as follows:


Support of Other Debug Windows
We can also use other debug windows while debugging use code map. Double clicking any node opens the stack frame code in a code editor window. Here we can use Locals, Immediate, Autos and other debug windows to see the exact values of parameters. In order to see the context of Locals and Autos windows you can see the context node as shows with a green sign as in the following image. The current break point node is shows with a yellow arrow pointing the node.


Here we have shown Autos, Locals and Immediate window. You can see the value of an argument, named userName.


Reuse of Code Map for multiple Debug Sessions
Code map also allows the same graph to be used during multiple debug sessions. This makes it easier to compare the call stack between multiple debug sessions. In the above call stack, we would like to see why even logs are not registered in the event store. Let's assume we get the following call stack in the first debug session.


By looking at the code we realize that there should be no call for RegisterAuthorizationLog from Main. It should actually be used directly by Authorize method. We update the code and start the debug session again. We insert a break point in RegisterAuthoriztionLog method. Now we get the updated call stack. In order to identify the current call hierarchy, you can only consider the red arrows. All the arrows from previous debugging sessions are grayed. Now you can see that the call hierarchy has actually been updated and you see the desired logs.


Comparison with Debugger Canvas
Code Map call stack can be compared with the actual call stack debug window and it stands out the comparison by providing the graphical layout of the actual call making it easier to understand the call hierarchy. But there is no comparison with Debugger Canvas extension. There are a lots of features in Debugger Canvas which has no parallel in Code Map Call stack. Debugger Canvas supports taking snapshot of arguments so if a method is called again we can compare the values, which is specially useful to look at recursive calls. The extension also has settings to reuse of the same graph and nodes or create a new graph in the same document file by adding a new channel. It supported better zoom support by double clicking the surface which only has limited support in Code Map. The code map is also not integrated with Intellitrace contrary to Debugger Canvas. Various options in Debugger Canvas can be controlled using options settings, there are no such settings for Code Map Call Stack.

Based on this comparison, we can assume that there would be a lot of improvements for Code Map debugging in the next Visual Studio Update. Let's hope for the best!!!